Main Figures from https://doi.org/10.1128/JVI.01987-13.
Figure 1 – Trimmed format of HSV-1 genomes
The complete HSV-1 genome includes two unique regions and two sets of large inverted repeats.
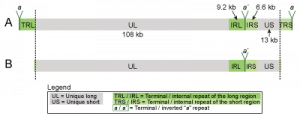
Figure 2 – G+C vs. A+T distribution spikes in herpesvirus repeat regions
Nucleotide compositional bias towards G+C residues in repeat regions of herpesvirus genomes.
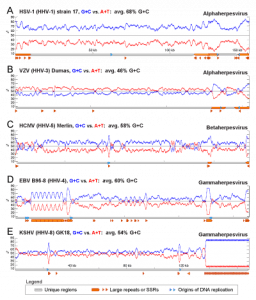
Figure 3 – Variability and conservation in the HSV-1 genome
Overview of the HSV-1 genome depicting coding regions, noncoding features, polymorphisms, and SSRs.
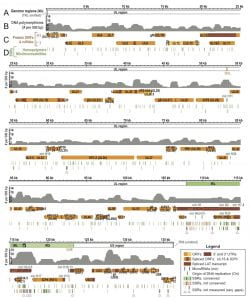
Figure 4 – Short Sequence Repeats
Localization and conservation of SSRs in HSV-1 strains.
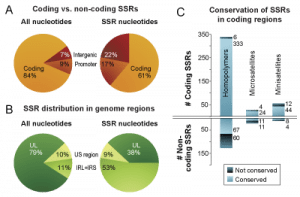
Figure 5 – AA Alignment of the divergent HSV-1 US11 protein
AA sequence conservation in the RNA-binding protein and PKR antagonist, US11.
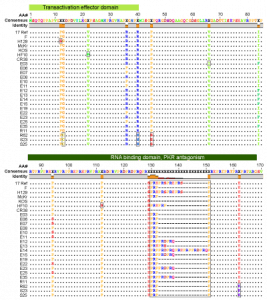
Figure 6 – Ratio of Non-synonymous to Synonymous Differences in HSV-1 proteins
Distribution of Ω substitution rates for all proteins of HSV-1.
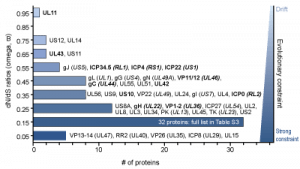
Figure 7 – gH and UL42
Coding diversity and positive selection of residues in the HSV-1 entry protein gH and the DNA-binding protein UL42.
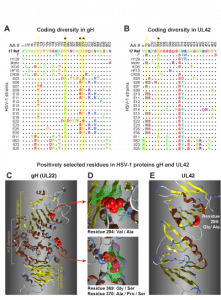
Figure 8 – Phylogenetic distances between HSV1 genomes
Dendrogram of genetic distances among HSV-1 genomes reveal broad geographic clustering.
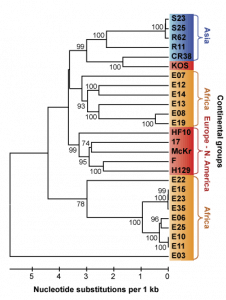
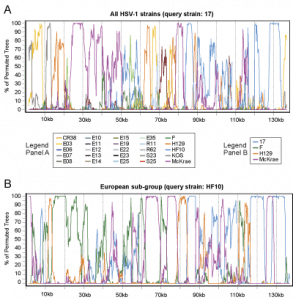
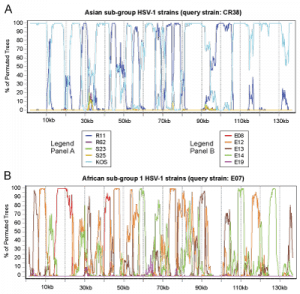
Figure 9 – Similarity between HSV-1 strains varies across the genome
Bootscan analysis of similarity between HSV-1 strains contain breakpoints suggesting frequent recombination.
Supplemental Figures from https://doi.org/10.1128/JVI.01987-13.
Figure S1 – GC vs. AT distribution in multiple HSV-1 strains
G+C-richness peaks in terminal and inverted repeats, in a pattern common across HSV-1 strains.
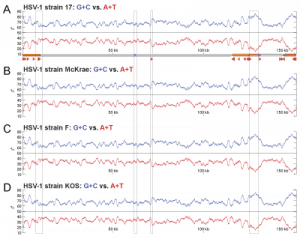
Figure S2 – Genome aberrations revealed by coverage depth changes
Read coverage scan from four HSV-1 strains depicting likely deletions in the UL55-UL56 region.
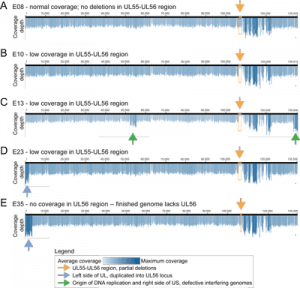
Figure S3 – Additional analyses of how similarity between HSV strains varies across the genome
Bootscan analysis of similarity between subgroups of HSV-1 strains suggests frequent recombination.
Additional Figures
Figure A1 – GC vs. AT distribution in twenty HSV-1 genomes
Nucleotide abundance of G+C vs. A+T for 20 new HSV-1 genomes. Line graph of G+C vs. A+T distribution in the twenty newly sequenced HSV-1 genomes reveals a pattern matching other HSV-1 strains (Figure 2). The trimming of terminal copies of the large repeats (Figure 1) removes the outermost spikes of G+C-richness seen in Figure 2A.
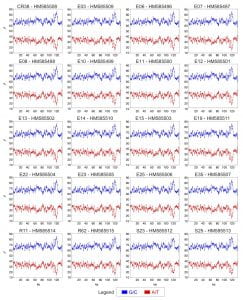
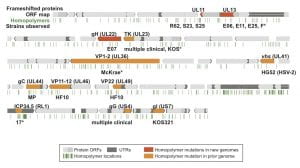
Figure A2 – Homopolymer-based frameshifts in HSV-1 proteins
Sites of current and previously recorded homopolymer-based frame shift mutations in HSV-1 proteins.